Forex Trading QuickStart Guide contains numerous trading charts, many of them depicting real-world trading scenarios. The charts in this book will often feature price action dynamics depicted in their entirety, from one end to the other, all at once. However, as author Troy Noonan often notes, real traders always experience their trades on “the right edge of the chart,” without knowing what’s going to come next.
That's why we created this visualization tool for Forex Trading QuickStart Guide readers. With this tool, you can view the many charts contained and explained within Forex Trading QuickStart Guide from the perspective of a real trader watching the price action develop from “the right edge of the chart.”
This tool is especially useful in the "In The Trading Room" Chapters (Ch 10, 12, and 14), though we’ve included essentially all the charts contained in the entire book (81 in total divided among two pages) for you to explore.
THIS IS PAGE 2 OF 2.
PAGE 1 CONTAINS "IN THE TRADING ROOM" CHARTS. TO SEE PAGE 1, PLEASE CLICK HERE
PAGE 2 CONTAINS "OTHER CHARTS"
The charts below utilize a slider. To use the slider, simply click and drag the slider across the chart to see how the charts would progress in real time.
Other Charts: Chapter 7
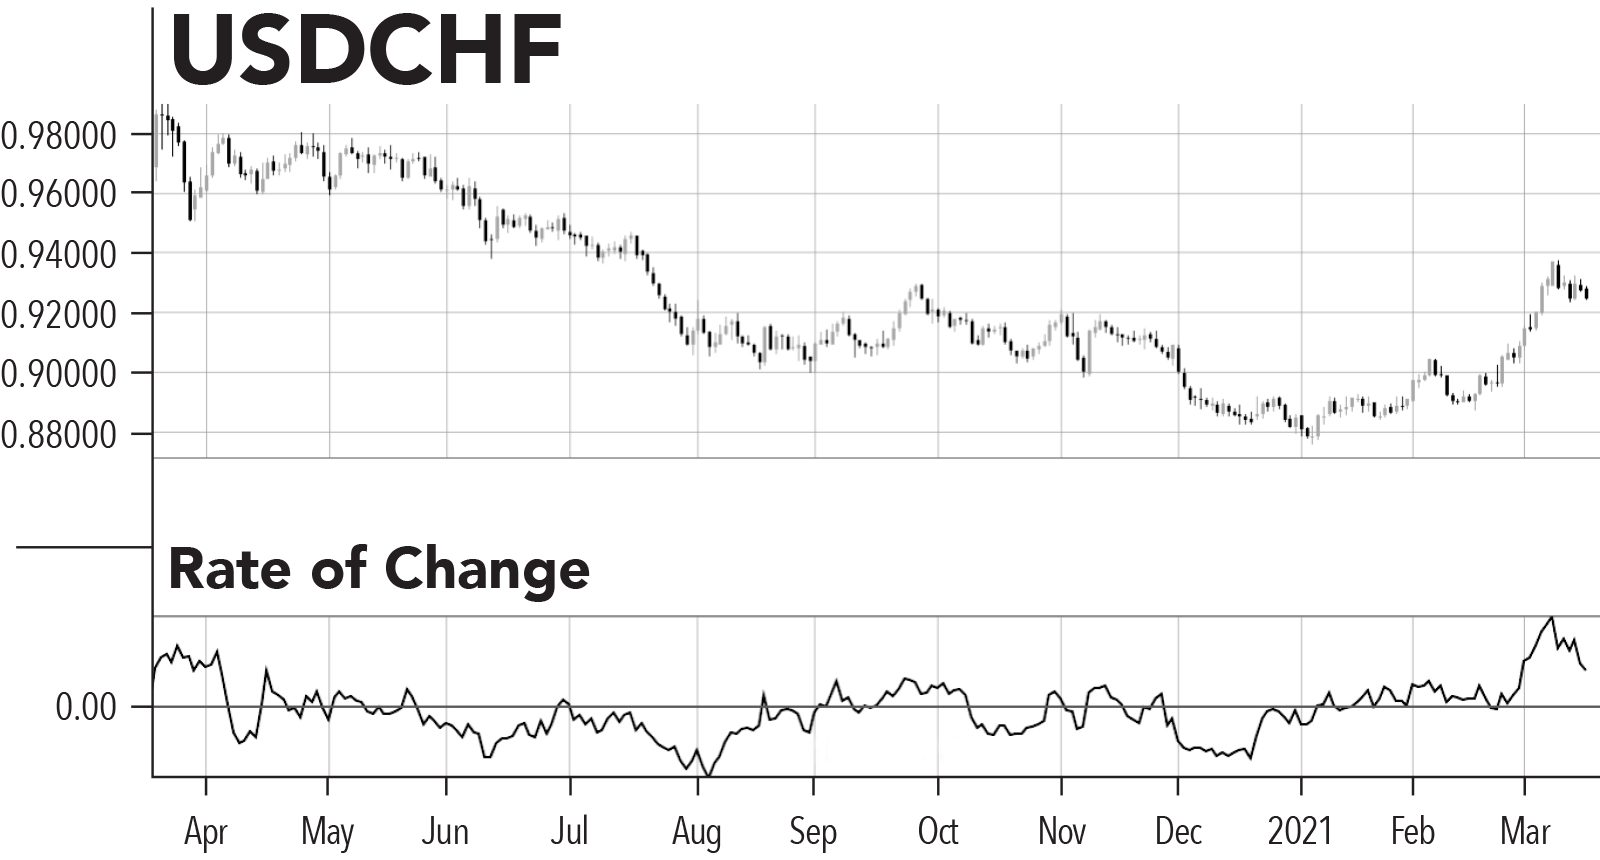
Figure 15, page 108
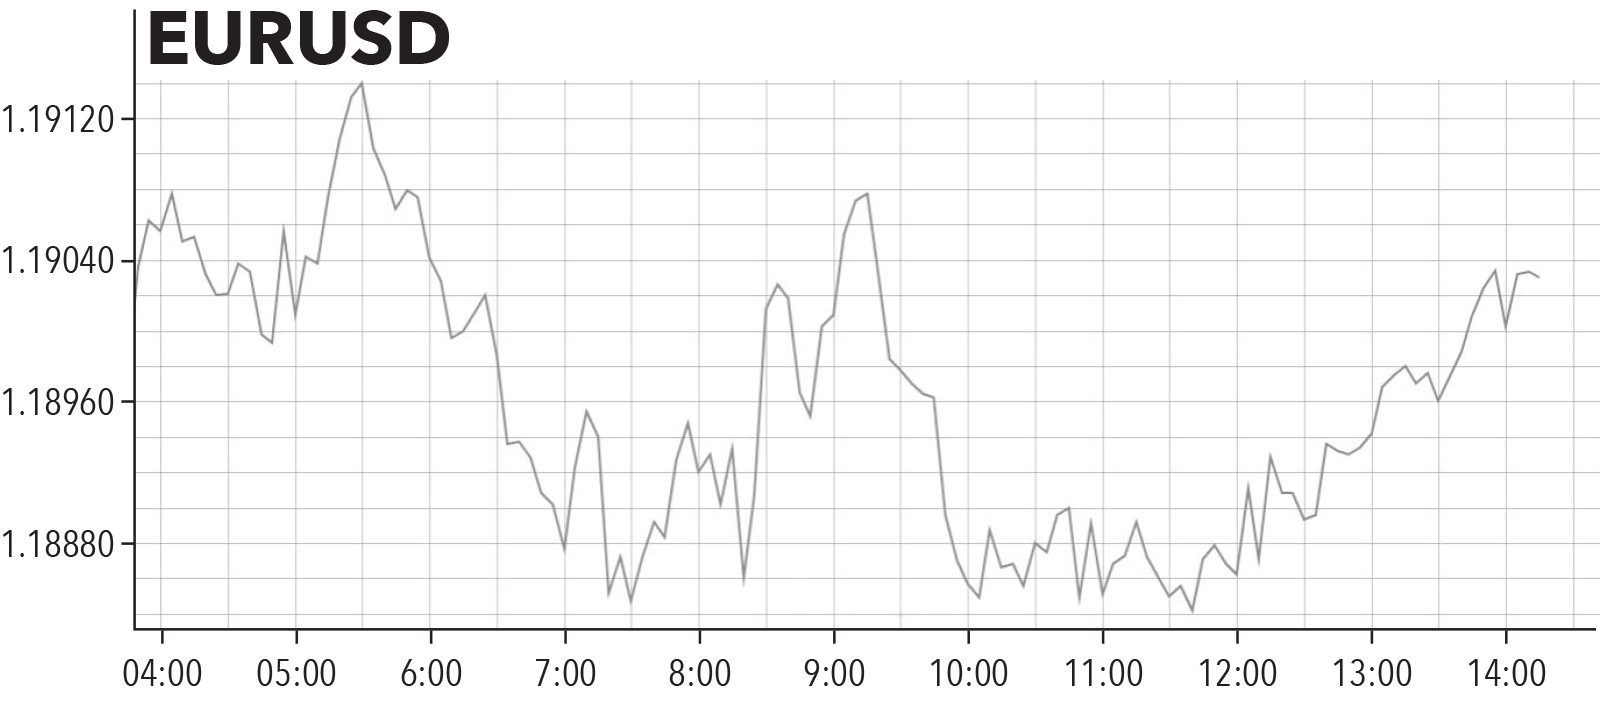
Figure 17, page 110
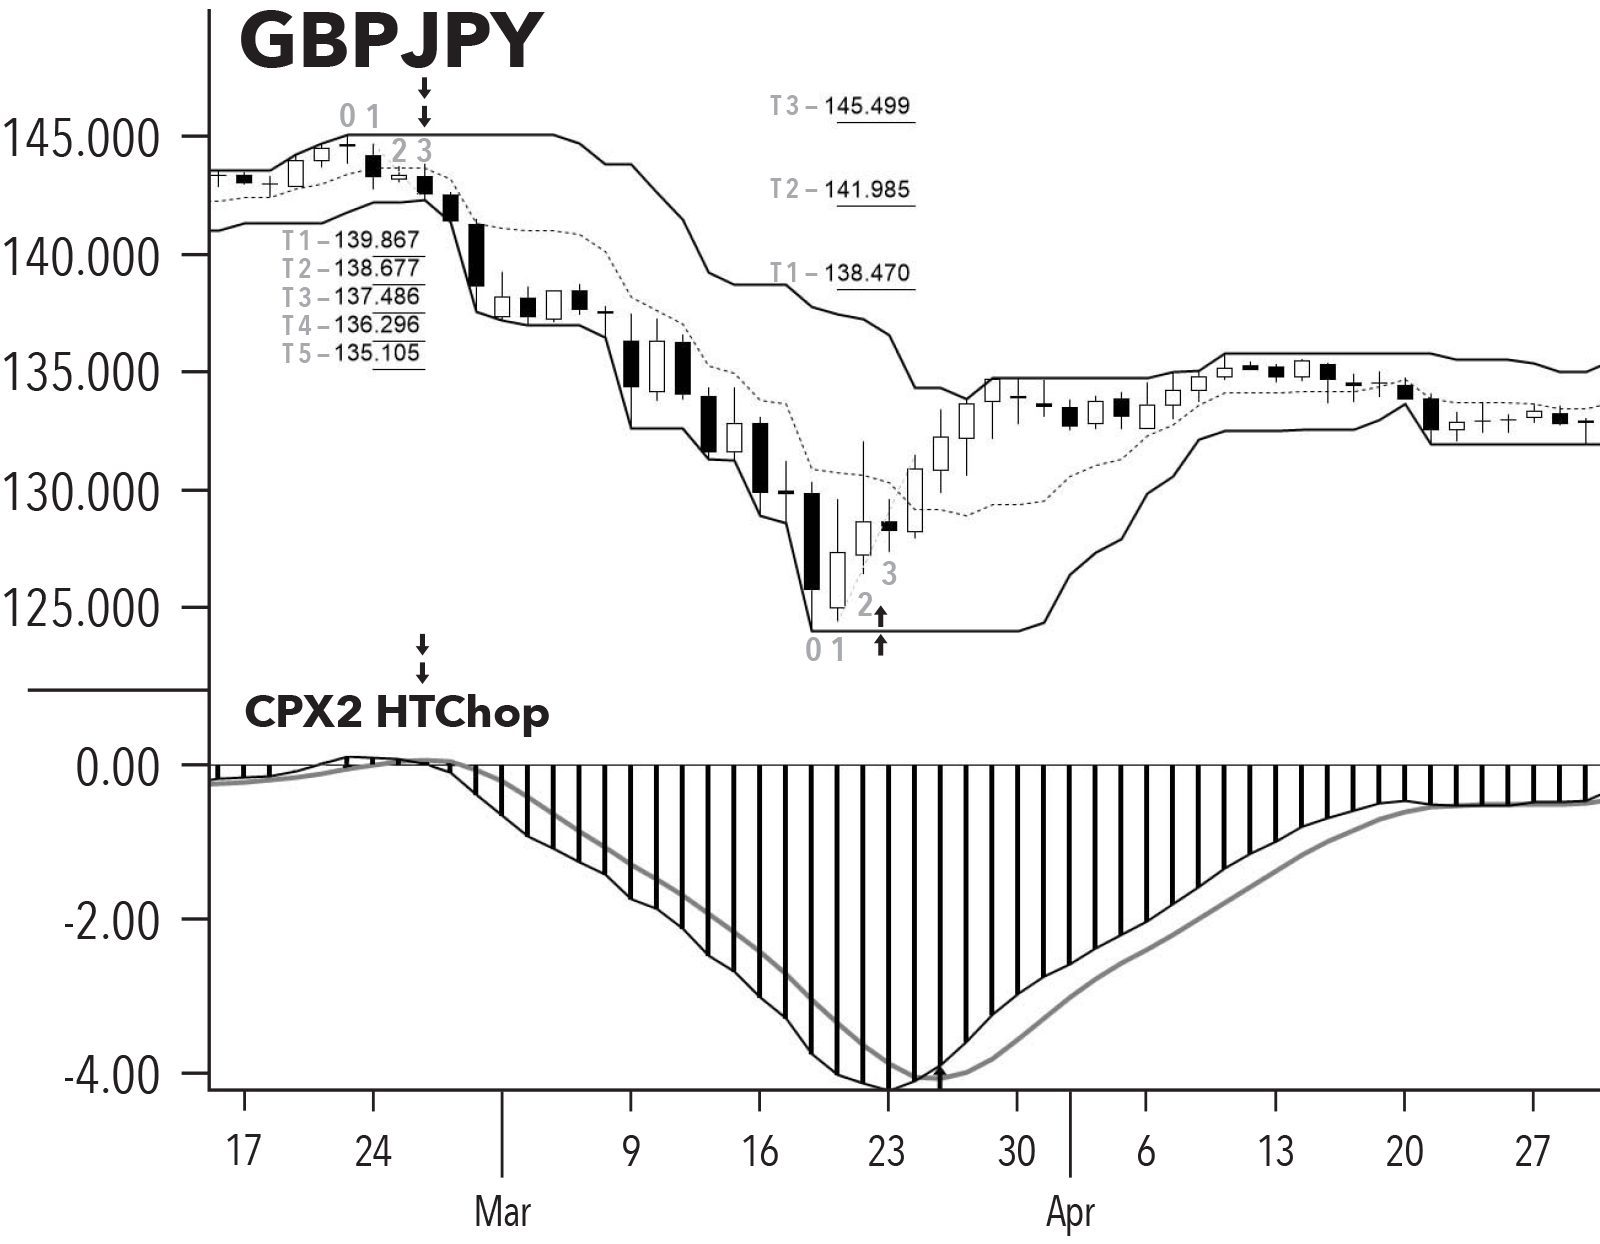

Figure 19, page 111
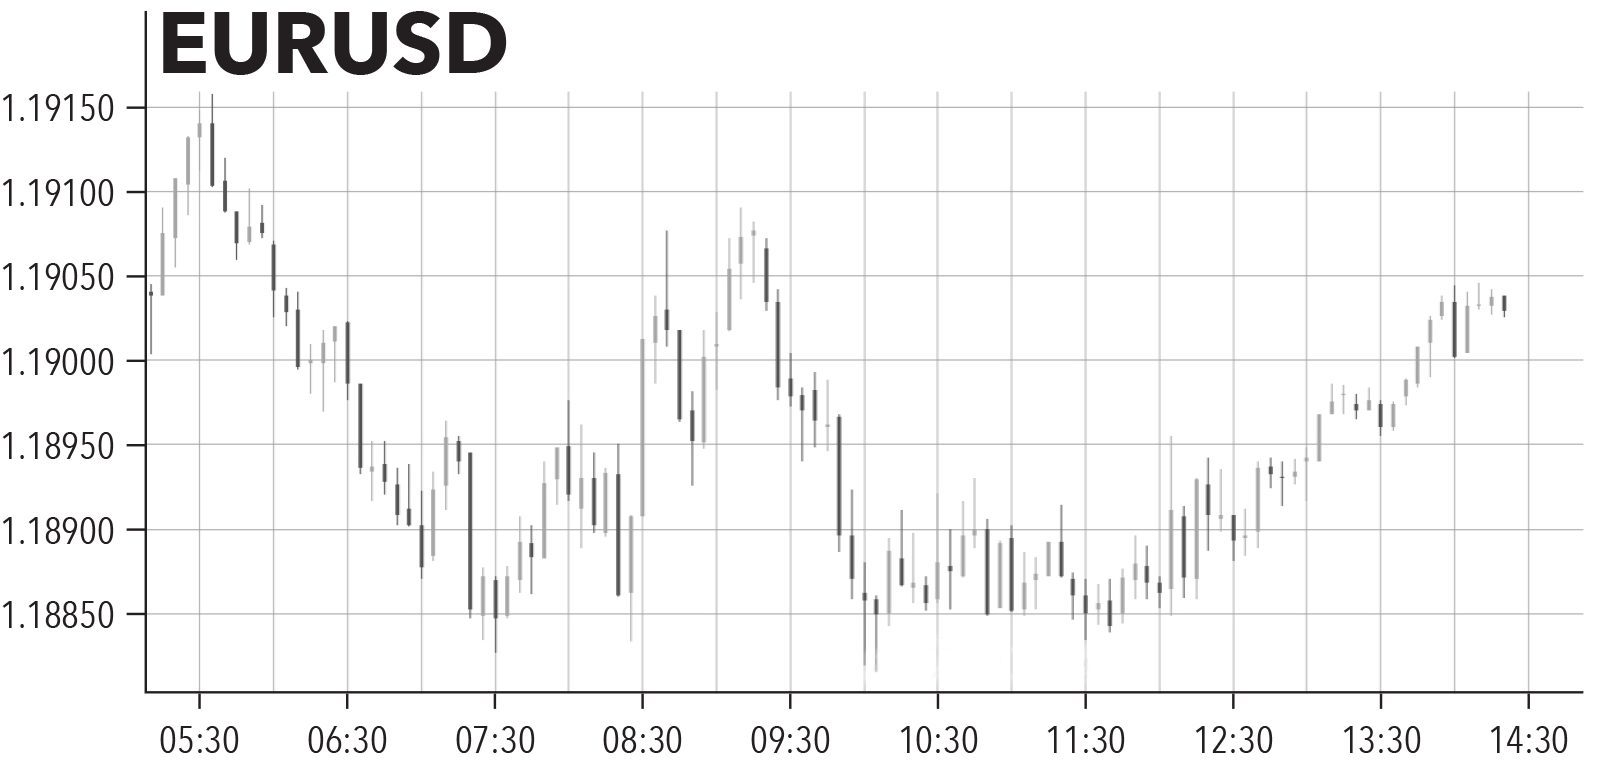
Figure 20, page 112
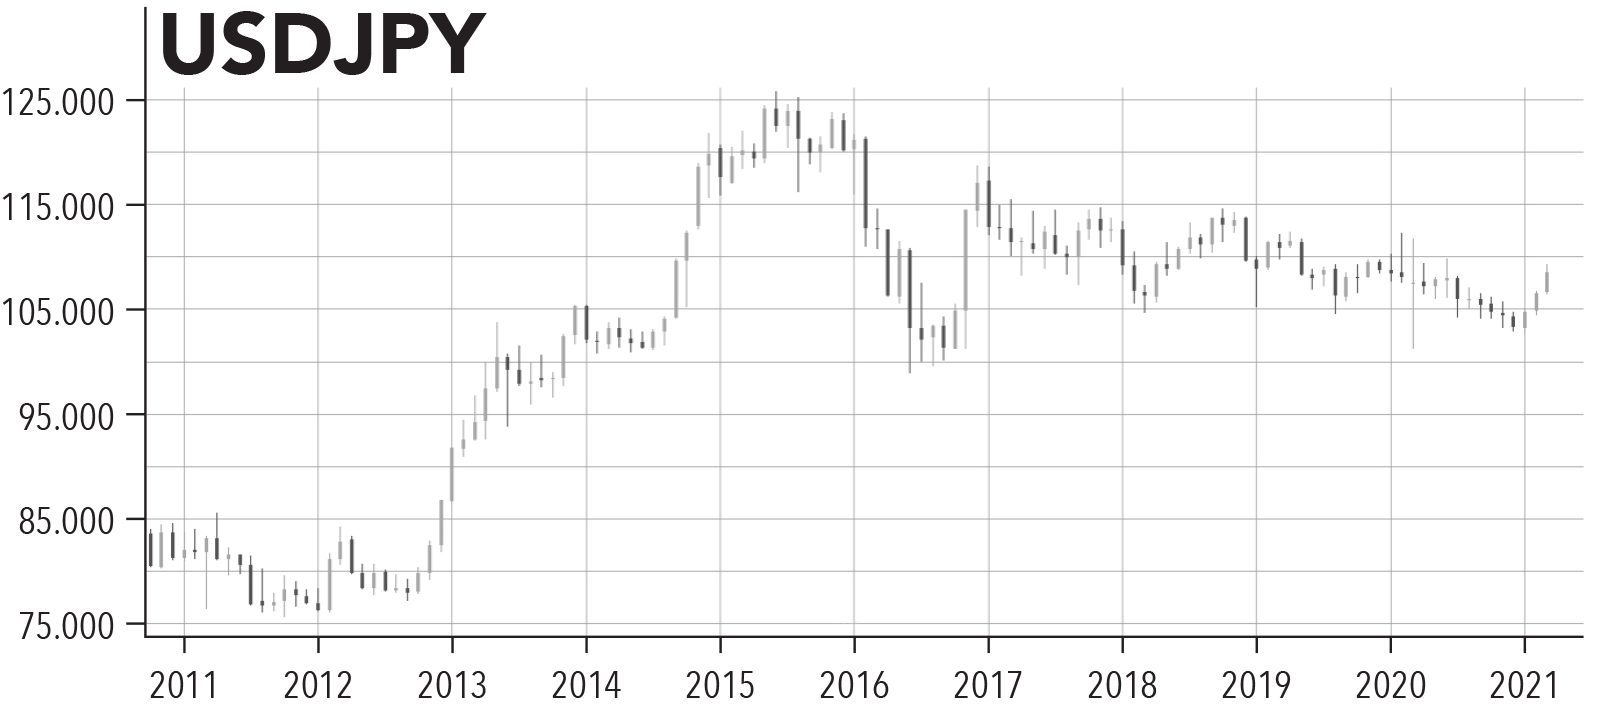
Figure 21, page 113
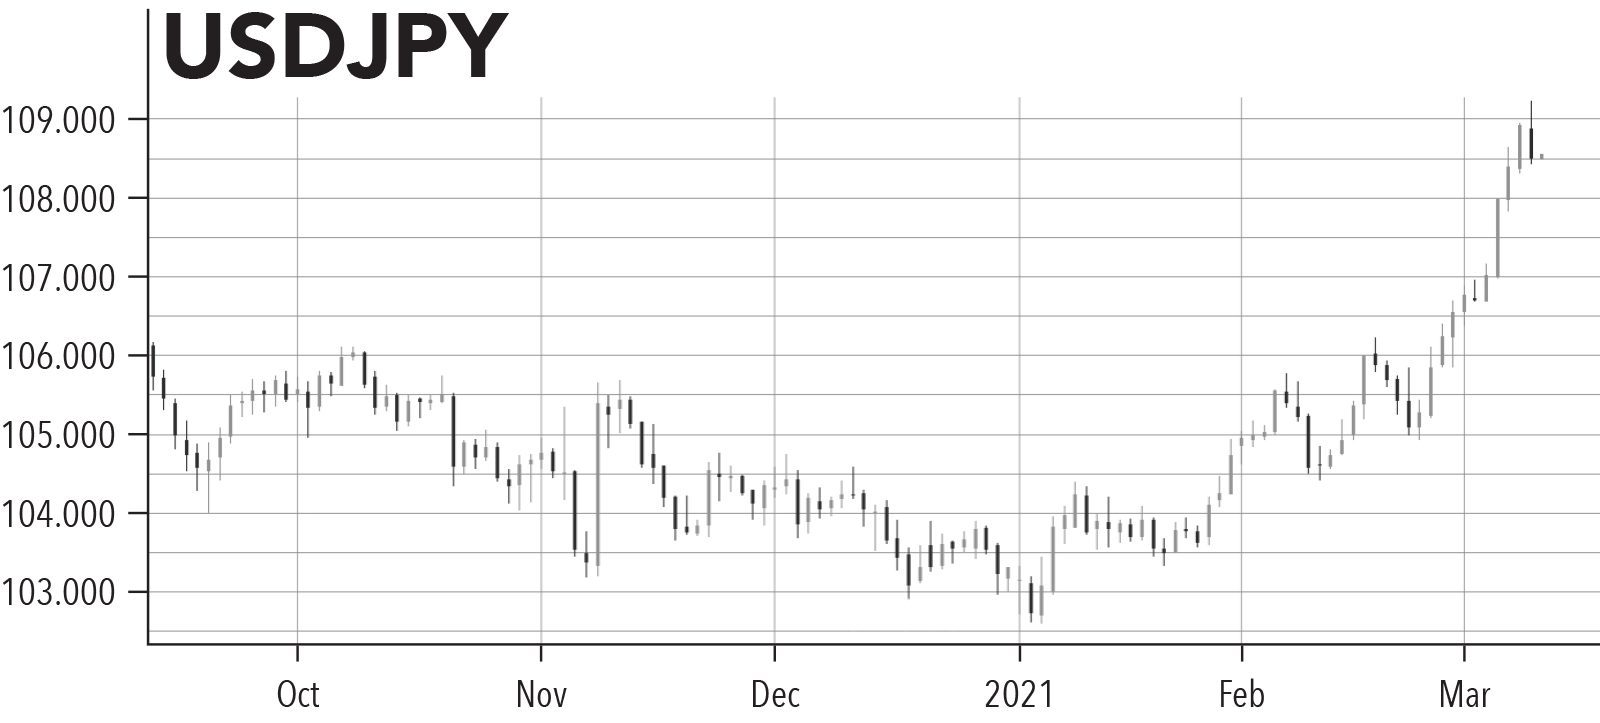
Figure 22, page 113
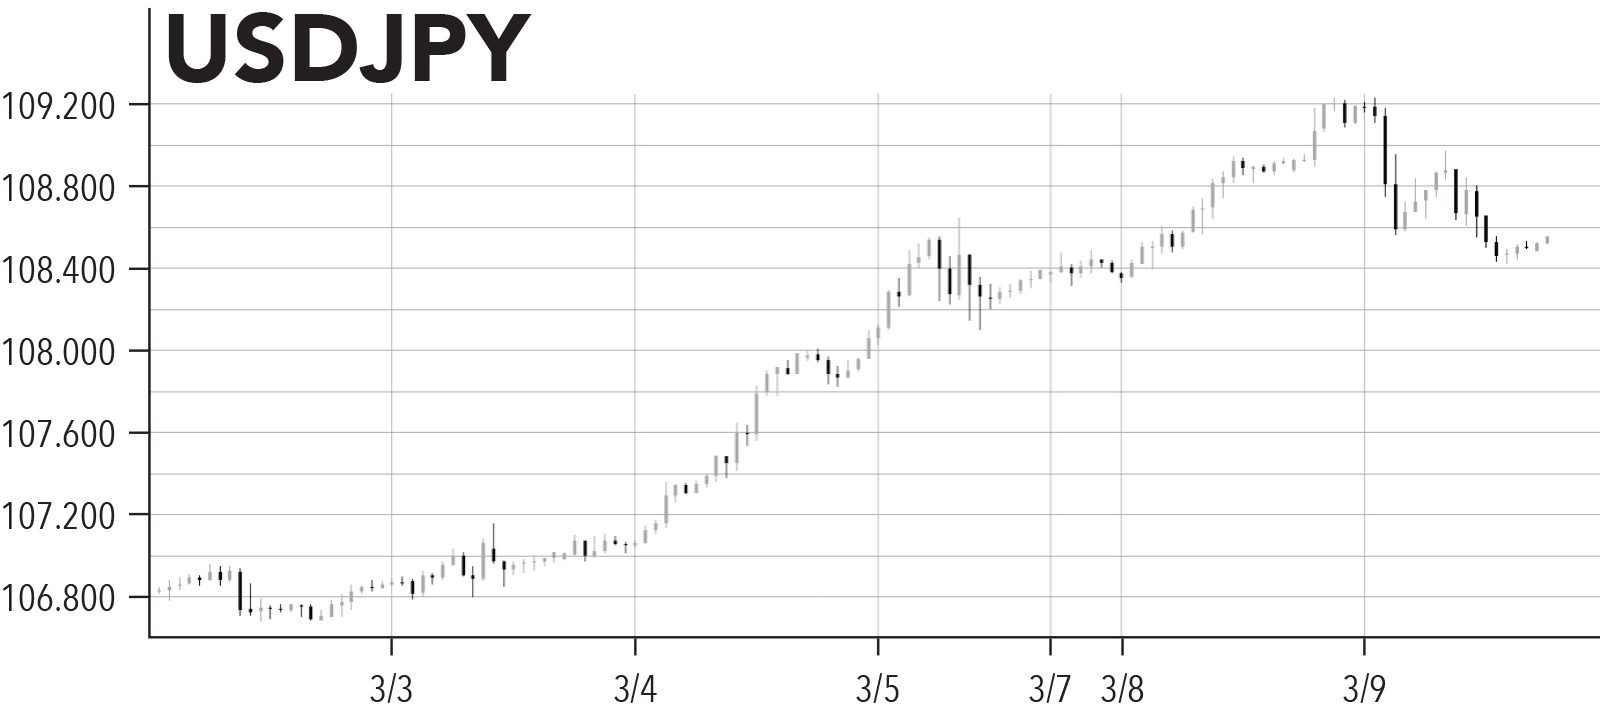
Figure 23, page 113
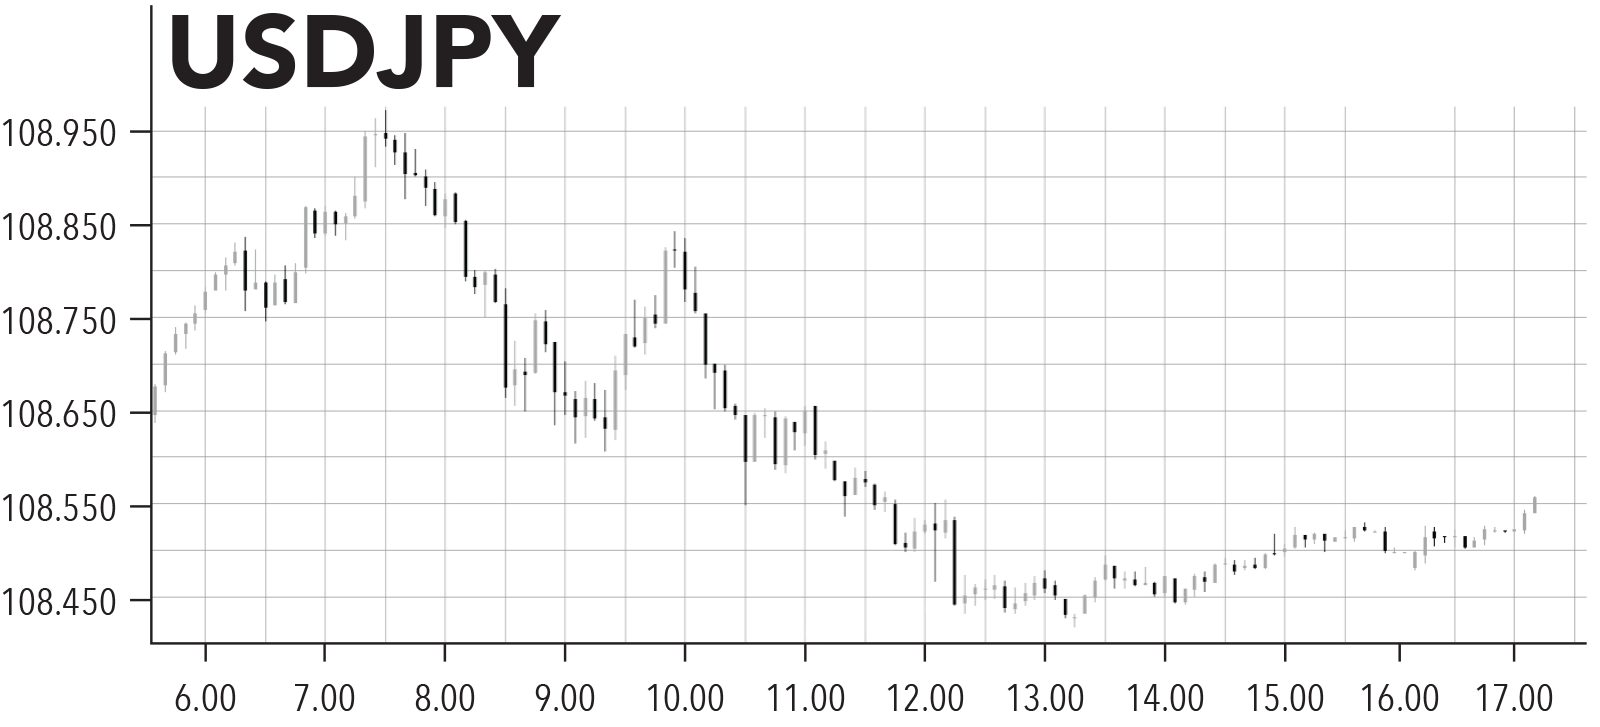
Figure 26, page 118
Figure 27, page 119
Other Charts: Chapter 8
Figure 28, page 125
Figure 29, page 128
Figure 30, page 129
Figure 32, page 131
Figure 33, page 131
Other Charts: Chapter 9
Figure 39, page 141
Figure 40, page 142
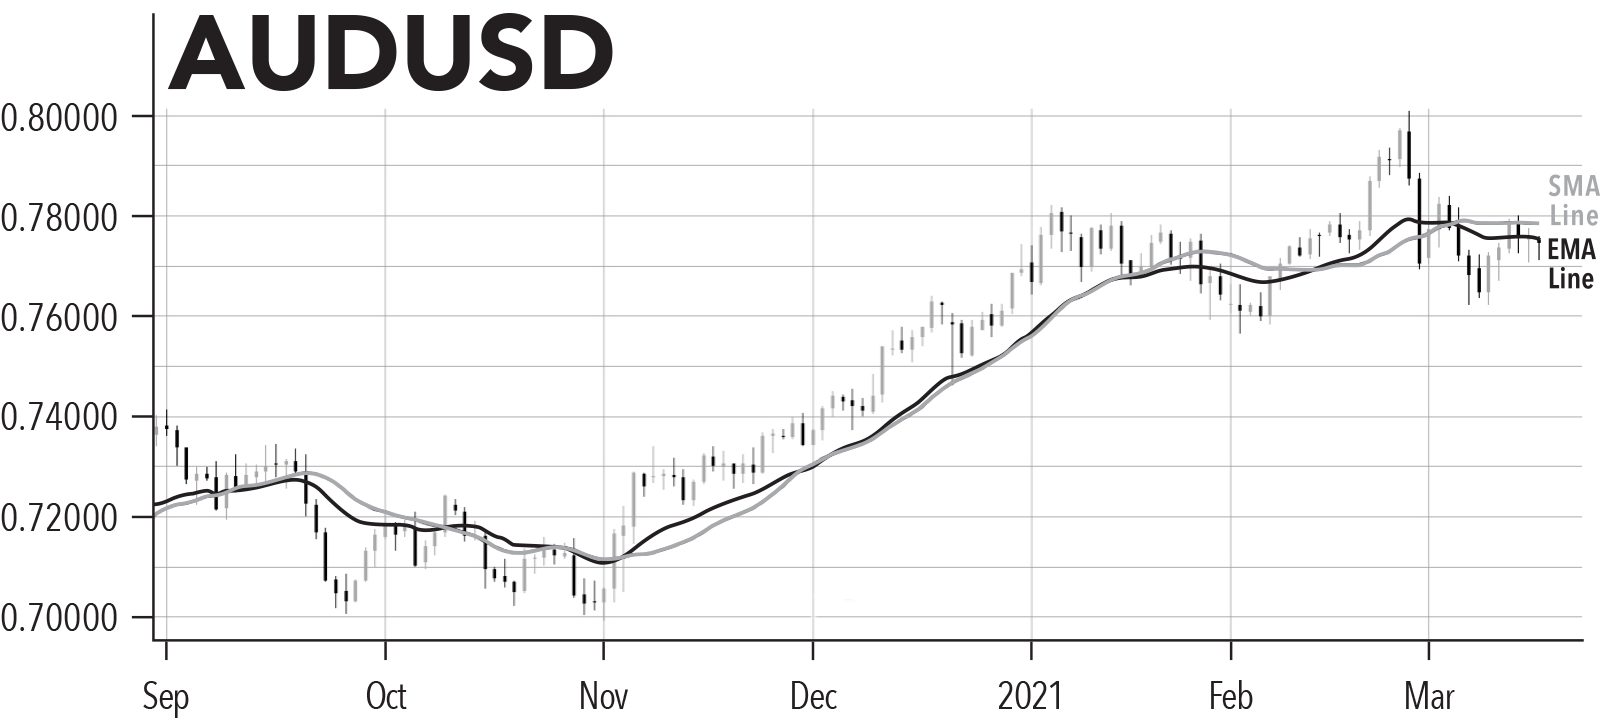
Figure 41, page 143
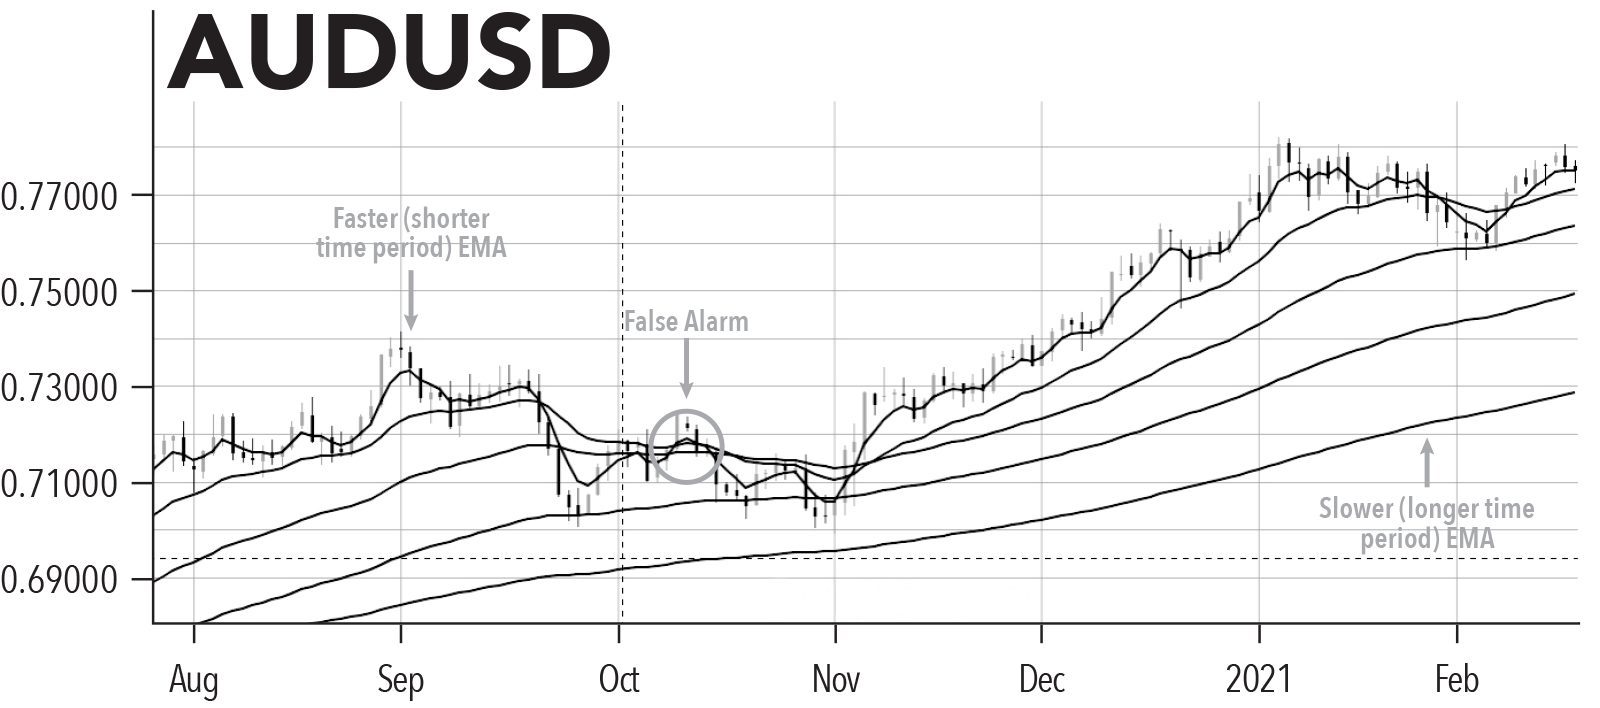
Figure 42, page 145
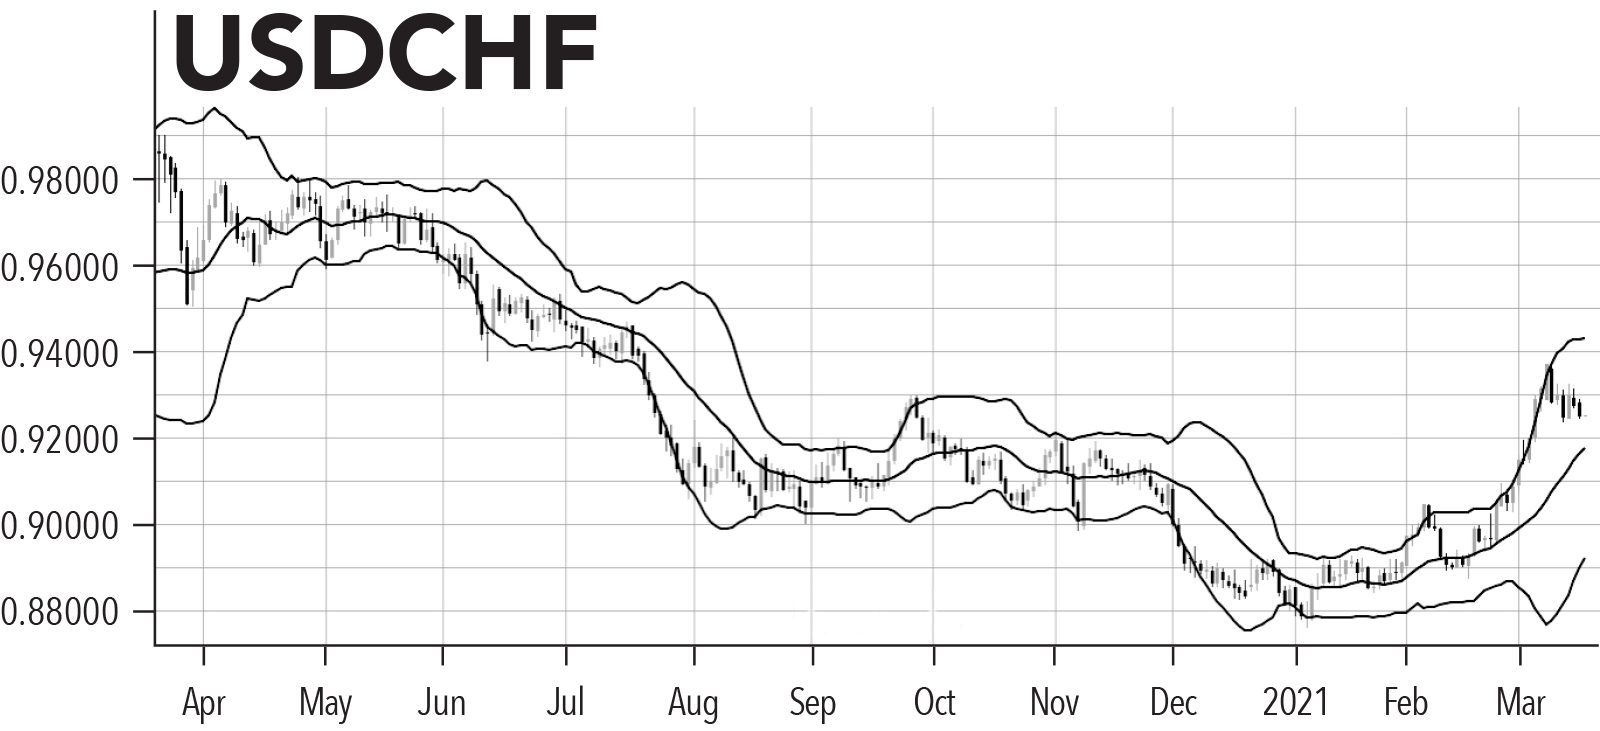
Figure 43, page 145

Figure 44, page 147
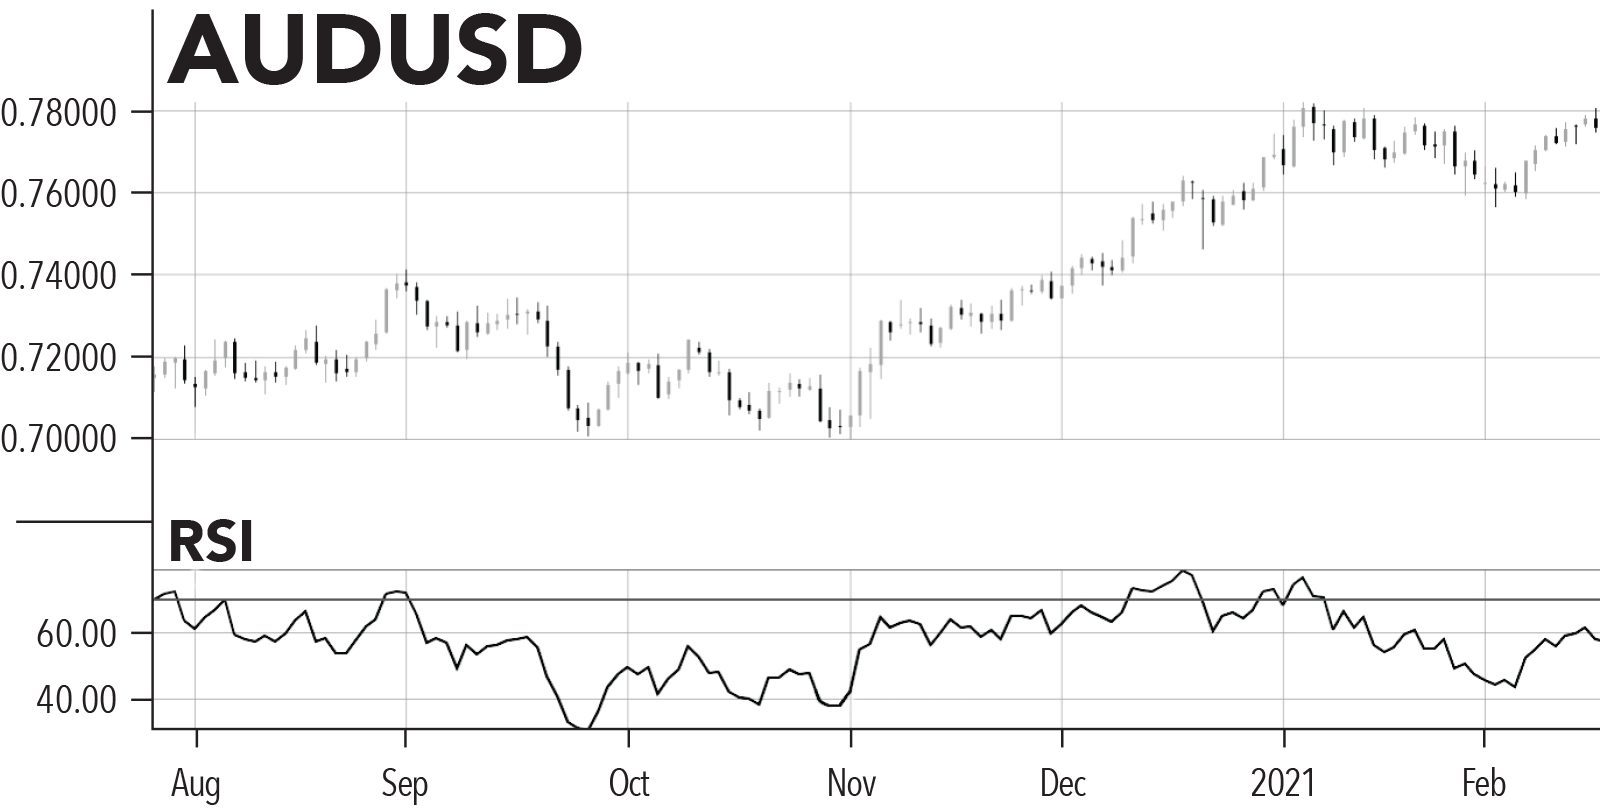
Figure 45, page 149
Figure 46, page 150
Figure 47, page 152

Figure 48, page 153
Figure 49, page 154